How to use the lightning alert graph
- Home
- Electric field strength graph
- How to use the lightning alert graph
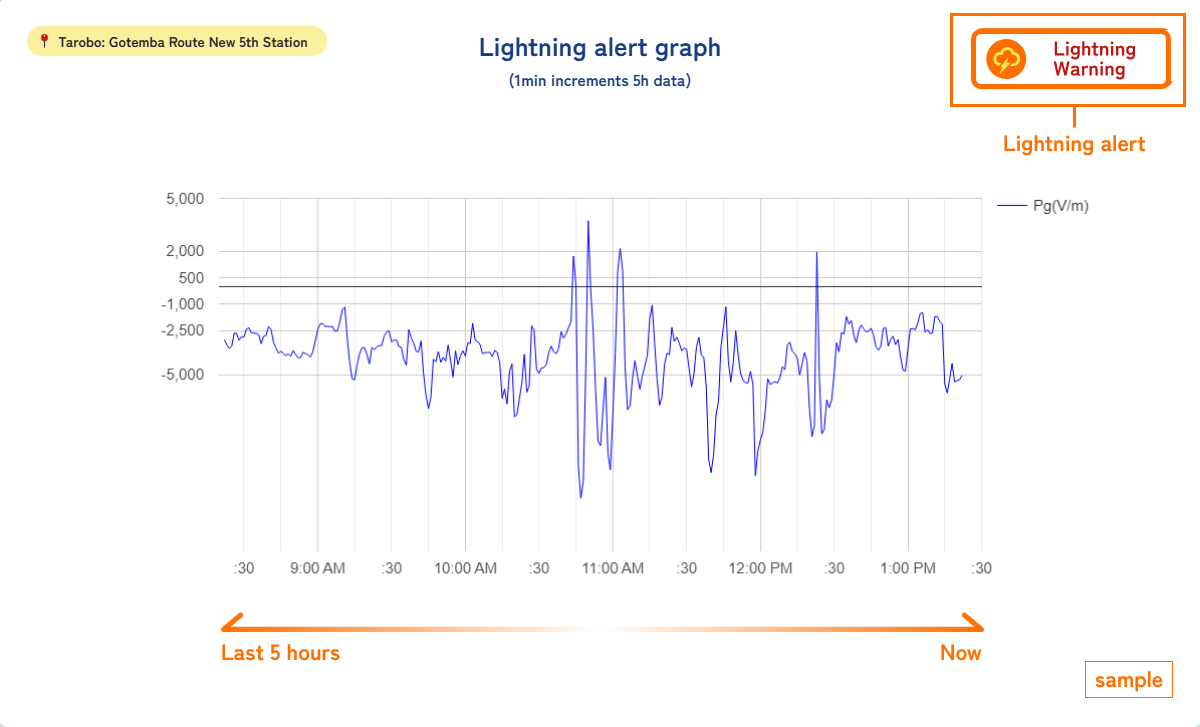
- Rotating field mill is used to measure the electric field intensity, collecting 1 data points per 0.5 second. This data is displayed from the present time up to one hour into the past.
- Based on the real-time 1-minute minimum values of electric field intensity and a predefined evaluation formula, the system determines whether to turn the lightning alert ON or OFF.
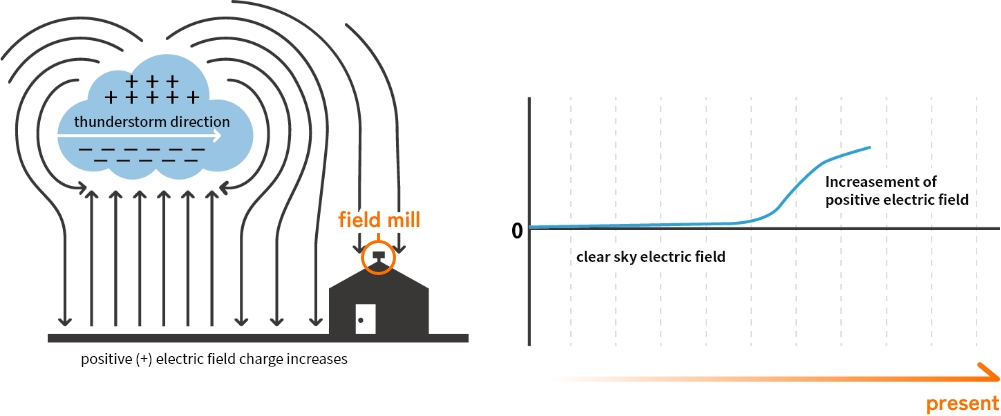
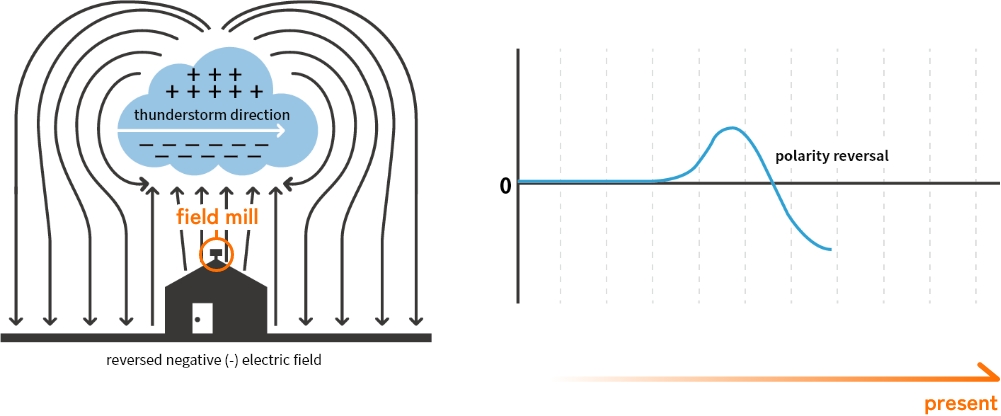
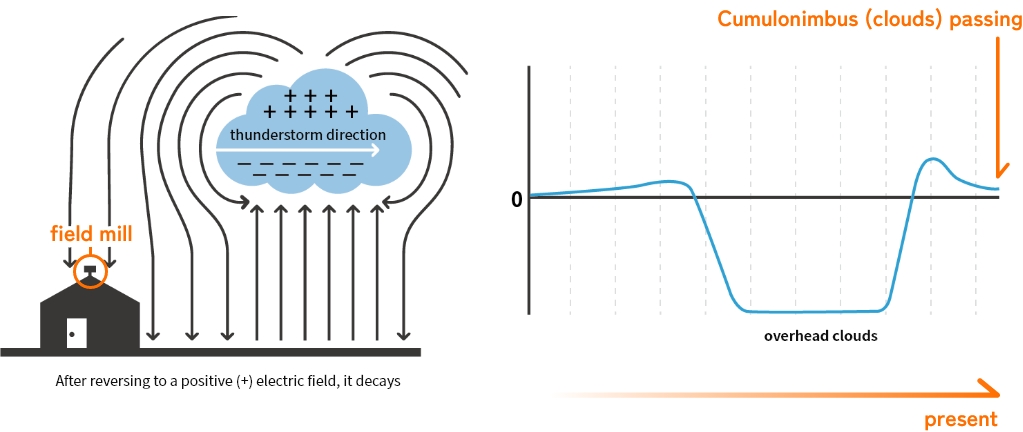
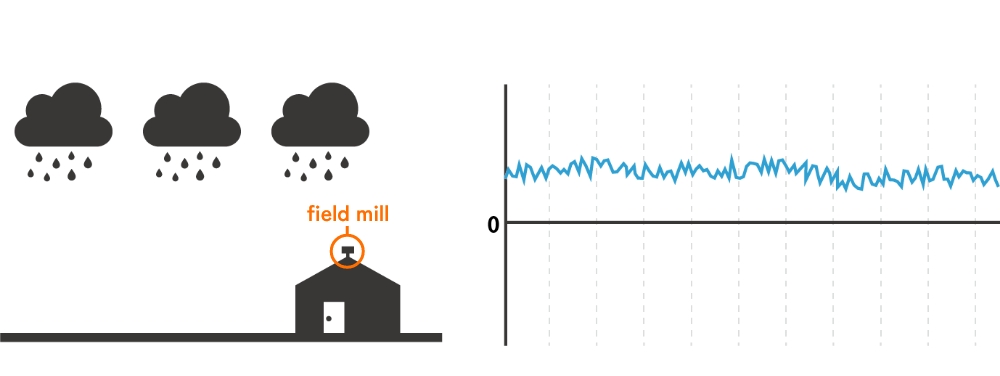
- You can check the graph to understand the atmospheric conditions over the past 5 hours, including whether cumulonimbus clouds were approaching or passing by.
- Although some noise has been filtered out compared to the raw data graphs on the site, there is still some noise present in the displayed data.
When the sky is clear and calm
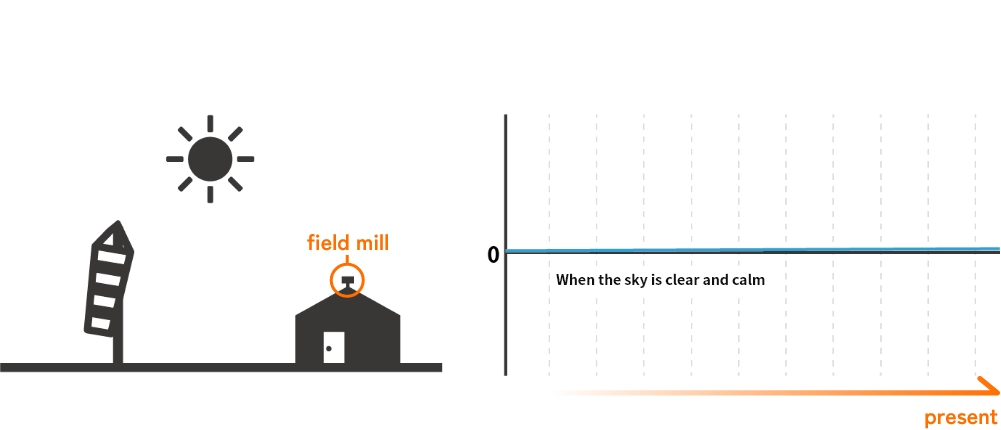
- The electric field strength when the sky is clear, and calm is about 100V/m.
- There is almost no change in the graph.


