How to use the actual measurement graph
- Home
- Electric field strength graph
- How to use the actual measurement graph
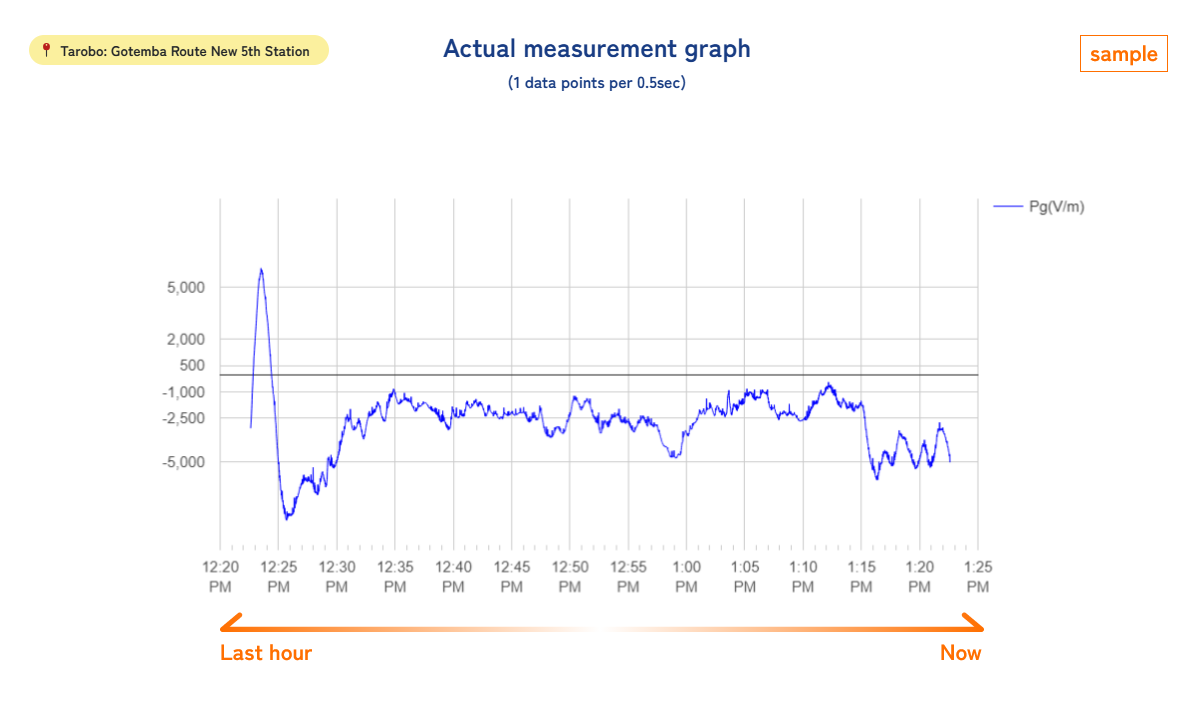
- Rotating field mill is used to measure the electric field intensity, collecting two data points per second. This data is displayed from the present time up to one hour into the past.
- You can check the graph to understand the atmospheric conditions over the past hour, including whether cumulonimbus clouds were approaching or passing by.
- The data includes noise caused by rain, snow, hail, sleet, dust, etc.
- During lightning events, the electric field intensity changes rapidly on a per-second basis. This allows to observe large-scale atmospheric movements.


