

How to use the lightning alert graph
- Home
- Electric field strength graph
- How to use the lightning alert graph
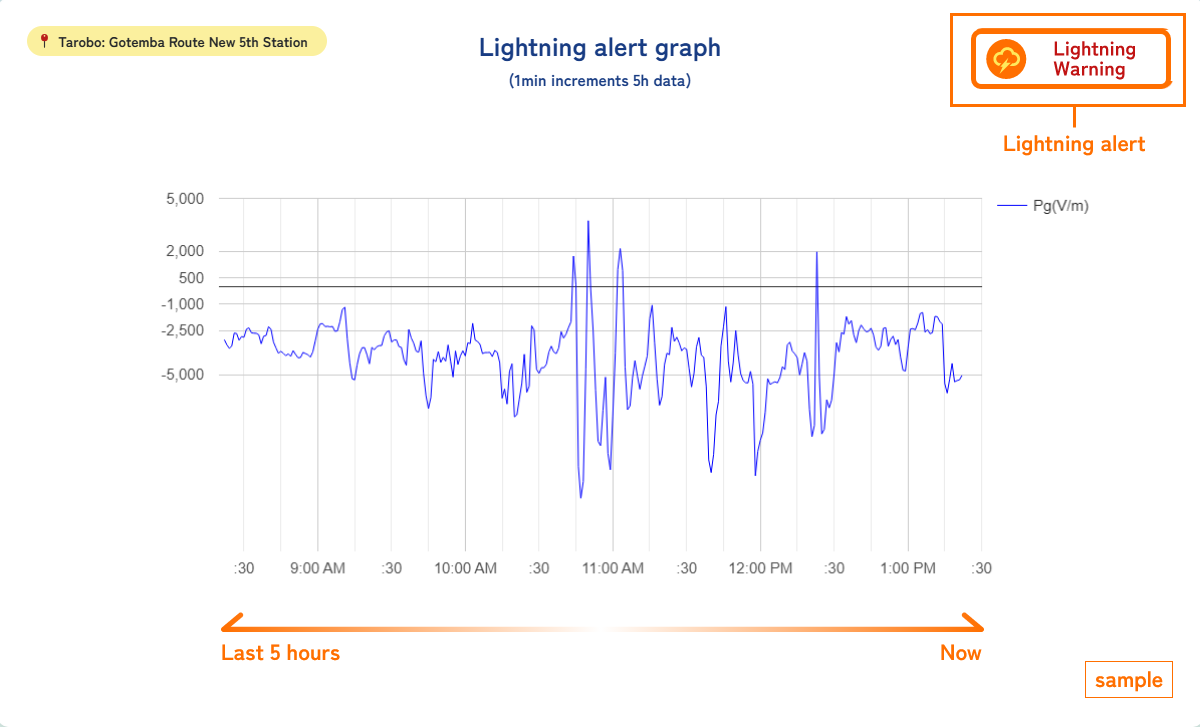
- Rotating field mill is used to measure the electric field intensity, collecting 1 data points per 0.5 second. This data is displayed from the present time up to one hour into the past.
- Based on the real-time 1-minute minimum values of electric field intensity and a predefined evaluation formula, the system determines whether to turn the lightning alert ON or OFF.
- You can check the graph to understand the atmospheric conditions over the past 5 hours, including whether cumulonimbus clouds were approaching or passing by.
- Although some noise has been filtered out compared to the raw data graphs on the site, there is still some noise present in the displayed data.
model graph
Note: The graph below may not necessarily apply to all cumulonimbus clouds.
1
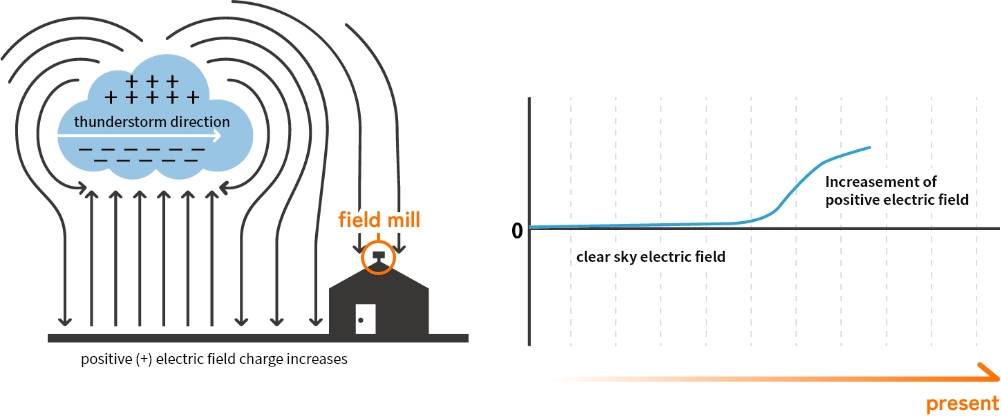
Approach of cumulonimbus clouds
2
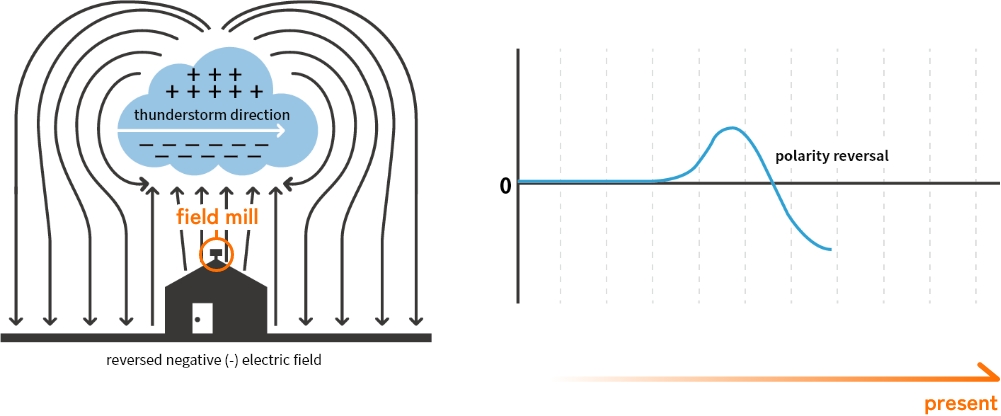
Passing of cumulonimbus clouds
3
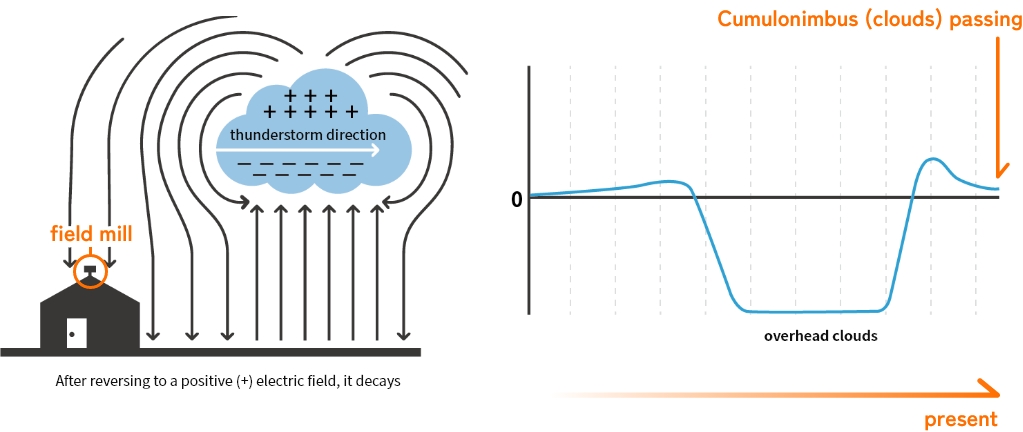
After cumulonimbus clouds passed by
When the sky is clear and calm
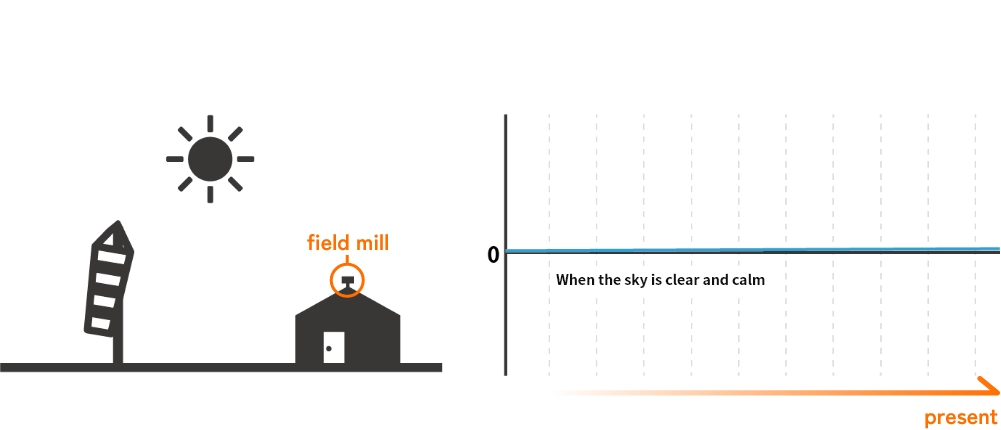
- The electric field strength when the sky is clear, and calm is about 100V/m.
- There is almost no change in the graph.
Noise
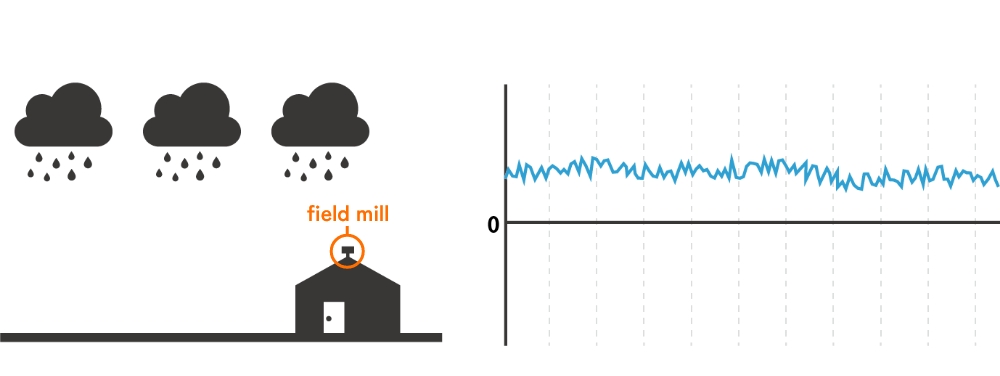
- Rain, snow, hail, sleet and dust can carry an electric charge. When these encounter the Field Mill’s sensors, the Field Mill will read them as noise.
- The noise is much smaller than the electric field strength of approaching and passing cumulonimbus clouds.